The data are in from the National Snow and Ice Data Center (NSIDC.org) for the month of June, 2012. By this time, if you have been keeping an eye on the Arctic (yeah, I know, not many people do, but still), it should come as no surprise that the rate of sea ice melt is increasing.
This graph from the NSIDC shows the average sea ice cover in the Arctic Ocean during the month of June for each year between 1978 and 2012...that's 34 years of data.
There is quite a bit of year to year variability in sea ice cover, you should expect this when you look at any natural system including everything from your heart rate to ice cover in the Arctic Ocean.
In climatology we do not look at year to year differences. Instead we look for long-term trends that may exist in the data. It's best when you have at least 30 years of data.
These data show a continuing trend decreasing average sea ice cover for the month of June. To all the people out there who enjoy contending that there is no significant climate change (i.e., global warming) happening, you don't have to believe me, just look at the data.
Like Daniel Patrick Moynihan, congressman and diplomat, once said, "Everyone is entitled to his own opinion, but not to his own facts." These data are some of the compelling facts.

Are there other compelling observation?
Yes there are...how about these?
Changes in the amount of ice cover on Greenland...this figure shows a recent trend of decreasing ice cover over the past 10 years..perhaps not a long enough data set to be compelling by itself, but the data suggest that a significant shift is happening...the result of ice melt on Greenland.

This set of maps shows the age of sea ice in the Arctic. The lighter the color, the older and thicker the ice is. 1987 on the left and 2011 on the right. The observation here is that there is less old (thick) sea ice than there used to be. Younger ice is thinner and melts faster in the spring/summer.

This map compares average land and surface temperatures in May 2012 to the average land and sea temperatures from 1971-2000. The observation here is that the earth is getting warmer almost everywhere, especially in the northern high latitudes. OK, so why isn't the North Pacific getting warmer? That is where deepwater currents are pushed back to the surface, and this cold deep water keeps that ocean basin cooler than the others.


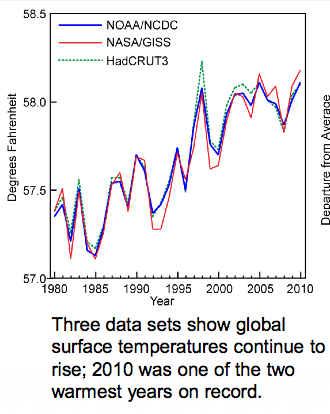
These data show what has happened with global average temperature over the past 30 years...again, there is year-to-year variability which is to be expected, but the overall trend is that things are getting warmer.
What about temperature changes in the USA? This map shows changes in temperature when you subtract the average July maximum temperature for 1971-2000 from the average July temperature for 1981-2000. The observation is that the western USA is warming significantly, and there is slight cooling in the heartland.

When we look at the same comparison for Winter temperatures though, we see SIGNIFICANT warming across the entire northern tier of states. In over words, on average, winters are not as cold as they used to be, especially the farther north you go.

These temperature changes also affect precipitation. Anyone living in the mountain west or southwest can tell you that less rain has been falling over the past years. The heartland, though, is getting more precipitation. Changing air temps affect how much water vapor it can hold, that that affects shifts in regional precipitation.

Lastly (for this posting) sea levels are rising. This is case along most of our coastlines. Oceanographers have concluded that most of the sea level rise that has occurred so far is the result of thermal expansion...ocean water getting warmer and less dense...rather than the result of ice caps melting...though sea levels will rise even more and faster once that speeds up.
OK, so why does sea level appear to be going down in some areas (e.g., Alaska)? Those are areas where tectonic forces are pushing the land up faster than sea level is rising. So it's not that sea levels aren't rising there, it's just that the land is being pushed up faster than sea levels are rising...so it's a relative change.

When you combine the indicators: land and sea average temperatures, ice cap melt area, Arctic Ocean sea ice melt, changes in latitudinal temperatures, shifts in precipitation, and sea level rise, the only conclusion I can reach is that the global climate is changing - warming. And so far the only viable explanation that climatologists have been able to come up with that explains why this is happening is the influx of anthropogenic greenhouse gases into the atmosphere starting in the 1800s and continuing through today.
When we remove the anthropogenic contributions to climate, the remaining natural climate forcing factors alone cannot explain our current observed trend of global warming.
No comments:
Post a Comment